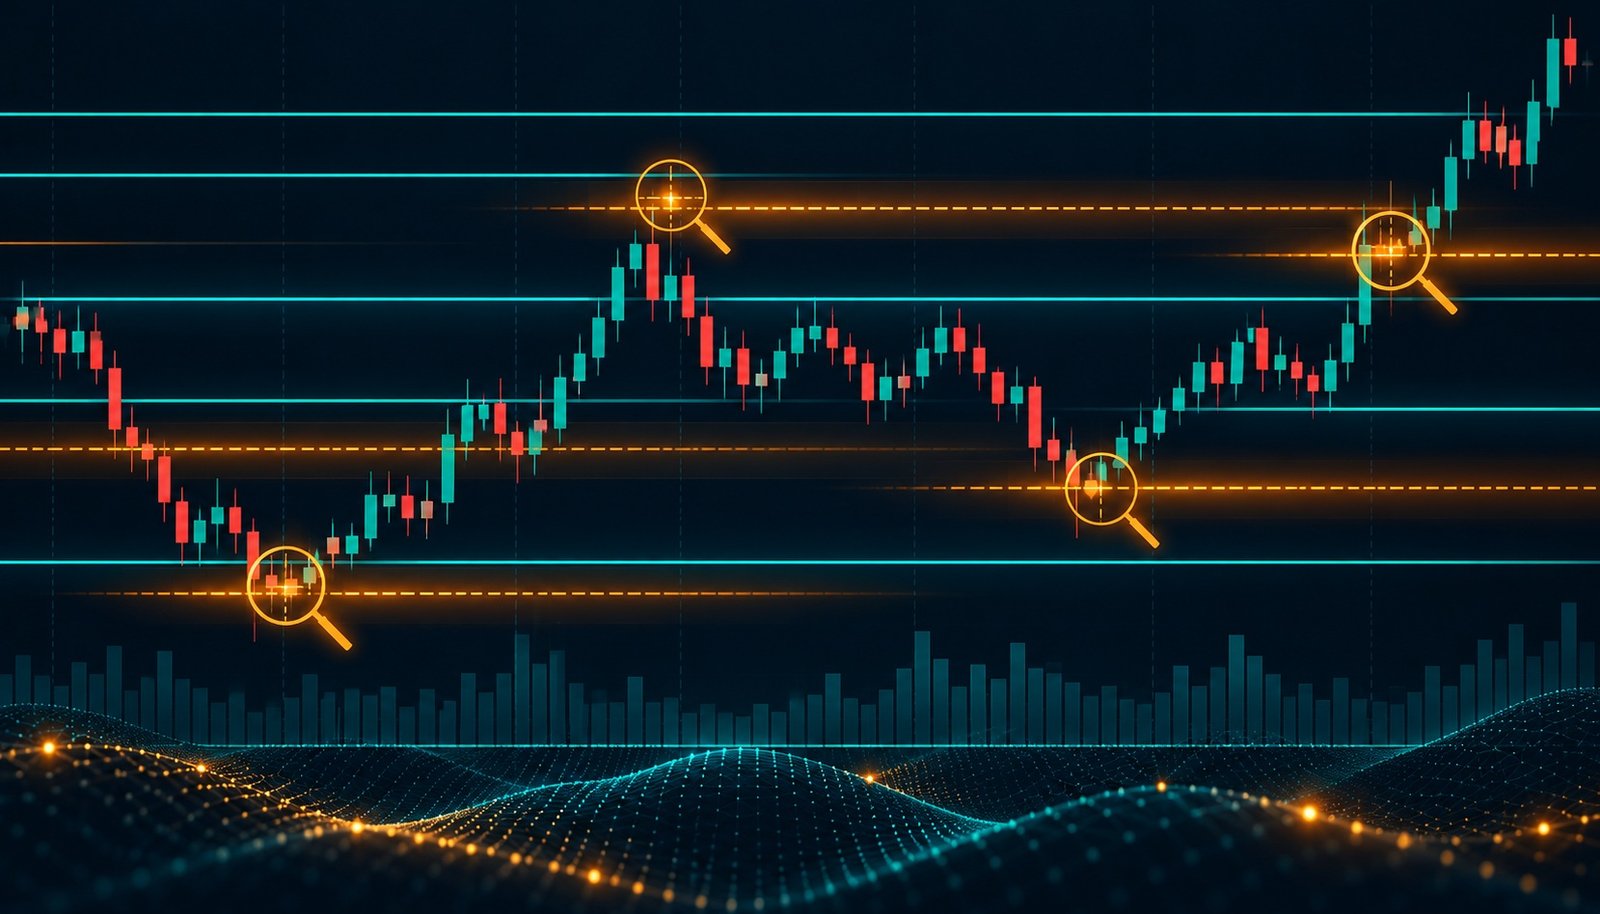
If you've been trading for more than a year, you've drawn hundreds of support and resistance lines by eye. You've looked at daily candles, picked out swing highs and lows, and marked them with a horizontal line. That approach works — until it doesn't.
Here's what you've been missing. There are entire categories of trading levels that human eyes simply cannot see consistently, no matter how experienced you are. A Super Intelligence trading engine finds them automatically because it processes mathematical relationships humans can't hold in working memory.
This isn't a brag about machines — it's an honest look at the specific blind spots in human level-reading, and how SI fills them.
1. Multi-timeframe confluence levels
Humans look at ONE timeframe at a time. You pull up the H4, mark your levels. Then you flip to the H1. Then the M15. By the time you're on M5, you've forgotten the exact H4 numbers. You see "roughly" where levels are. You miss the exact convergence points.
What SI does differently: holds all 6 timeframes in memory simultaneously. When a buy_above level on H4 lines up within 5 pips of a resistance on H1 AND a sell_below on D1 — that's a confluence zone. SI flags it instantly. For a human, this takes 20 minutes of chart-flipping, and you'll still miss it 40% of the time.
Practically: on XAUUSD last week, there was a 3-timeframe confluence at 4,138.50. H4, H1, and D1 all converged. Price touched it to the pip and reversed 22 points. A trader watching only H1 saw a weak-looking resistance. A trader using SI-powered multi-timeframe levels saw a high-probability reversal zone.
2. Volatility-adjusted levels (not just price levels)
Most retail traders think of levels as fixed price points: "support at 1.0850." But levels have different meaning depending on current volatility.
Example: 1.0850 as support when EURUSD is in a quiet 20-pip range is a different animal than 1.0850 as support when EURUSD is doing 90-pip NFP whipsaws. In quiet volatility, levels hold tighter. In high volatility, levels need wider stops OR get skipped entirely.
What SI does: computes levels using volatility-adjusted formulas. The buy_above on quiet-vol days might be 10 points above the pivot; on high-vol days it might be 25. The level ADAPTS. Humans don't adjust in real-time — they use the same mental "support/resistance" regardless of market condition.
3. Session-boundary levels
Price behaves differently in Asian / London / New York sessions. Levels that held in Asian session often break the moment London opens. Levels that formed in London often get re-tested the next day during the same hour.
This is where time-of-day context becomes a level in itself. A level that formed at London open is more defensible than a level that formed in the dead Asian zone.
What SI does: tags every level with the session it formed in, and weights its probability of holding based on which session is currently active. A level from London is given higher respect when London is open again. A human can learn this intuitively over 10 years. SI applies it from day one.
4. Correlation cluster levels
XAUUSD doesn't move in isolation. It correlates with DXY (negatively), with 10Y treasury yields, with risk-off sentiment, with crude oil during inflation cycles.
When XAUUSD's level at 4,120 aligns with DXY's technical level at 103.50 AND a 10Y yield level at 4.2% — that's a correlation cluster. The probability of all three moving simultaneously is low; the probability of the XAUUSD level holding when the cluster triggers is high.
What SI does: continuously computes cross-asset correlations and flags when a level is reinforced by its correlated instruments. A human would need Bloomberg Terminal plus 20 years of macro experience to do this manually.
5. Statistical micro-structure levels
This is the one that surprises traders the most. Market microstructure has mathematical regularities that are invisible to the naked eye but obvious to a system that processes thousands of candles per second.
Examples:
- Volume-at-price nodes: prices where the most trading has occurred historically — act as magnets. Hard to see on a line chart; easy for SI to compute.
- Fractional retracement nodes: not just 38.2% and 61.8% Fibonacci — but the actual historical bounce zones for THIS specific symbol in THIS specific regime.
- Open-interest shift levels: for futures-tracked symbols, levels where open interest has concentrated during the current trading session.
- Round-number magnetism: every trader knows round numbers matter — but WHICH round numbers for THIS symbol? XAUUSD responds strongly to multiples of 50; EURUSD responds strongly to multiples of 25. SI knows these per-symbol.
The biggest lesson from 10 years of comparing human-drawn levels to SI-computed levels: humans see what they EXPECT to see. SI sees what's statistically there.
Why humans will always draw levels — and why SI augments rather than replaces
None of this means you stop looking at charts. Human pattern recognition does things SI can't: it reads news context, it feels when the market "wants" to go somewhere, it factors in your own account state and emotional capacity. These are irreplaceable.
What SI does is remove the mathematical blind spots. You still make the trade. You still pick the position size. You still decide when the context is right. SI just hands you a cleaner, more objective layer of information to overlay on your judgment.
What this looks like in LevelEngine
Open the terminal, pick any symbol. You'll see:
- A buy_above and sell_below zone — the main decision levels, volatility-adjusted
- R1 through R5 resistance ladder, S1 through S5 support ladder
- H4 Levels overlay — shows the 4-hour window's zones so you see confluence against your current M5/M15 timeframe
- Daily S/R overlay — shows today's full-day zones
- Historical levels view — shows how yesterday's and last week's zones played out, so you can backtest-feel the hit rate
All of it is computed by the SI engine using the same deterministic math — you can audit any level by checking the sitewide methodology and hit-rate page.
Bottom line
Human traders miss levels not because they're bad — because the human visual system wasn't designed to hold 100 symbols × 6 timeframes × volatility context × session context × correlation data all at once. Super Intelligence Trading is a mathematical aid, not a replacement for judgment. Use it to see what you can't see. Keep your judgment for everything else.
See the levels you've been missing
LevelEngine shows you the multi-timeframe confluence, volatility-adjusted zones, and session-aware levels — on any of 100+ symbols. Try free for 7 days.