Ask ten traders what the difference is between support/resistance and supply/demand zones, and you'll get ten different answers. Some think they're the same thing. Some think one is "advanced" and the other is "beginner." Both views are wrong. Here's what each actually is, when to use each, and how our AI-computed daily zones combine the best of both.
Support and resistance: what it really is
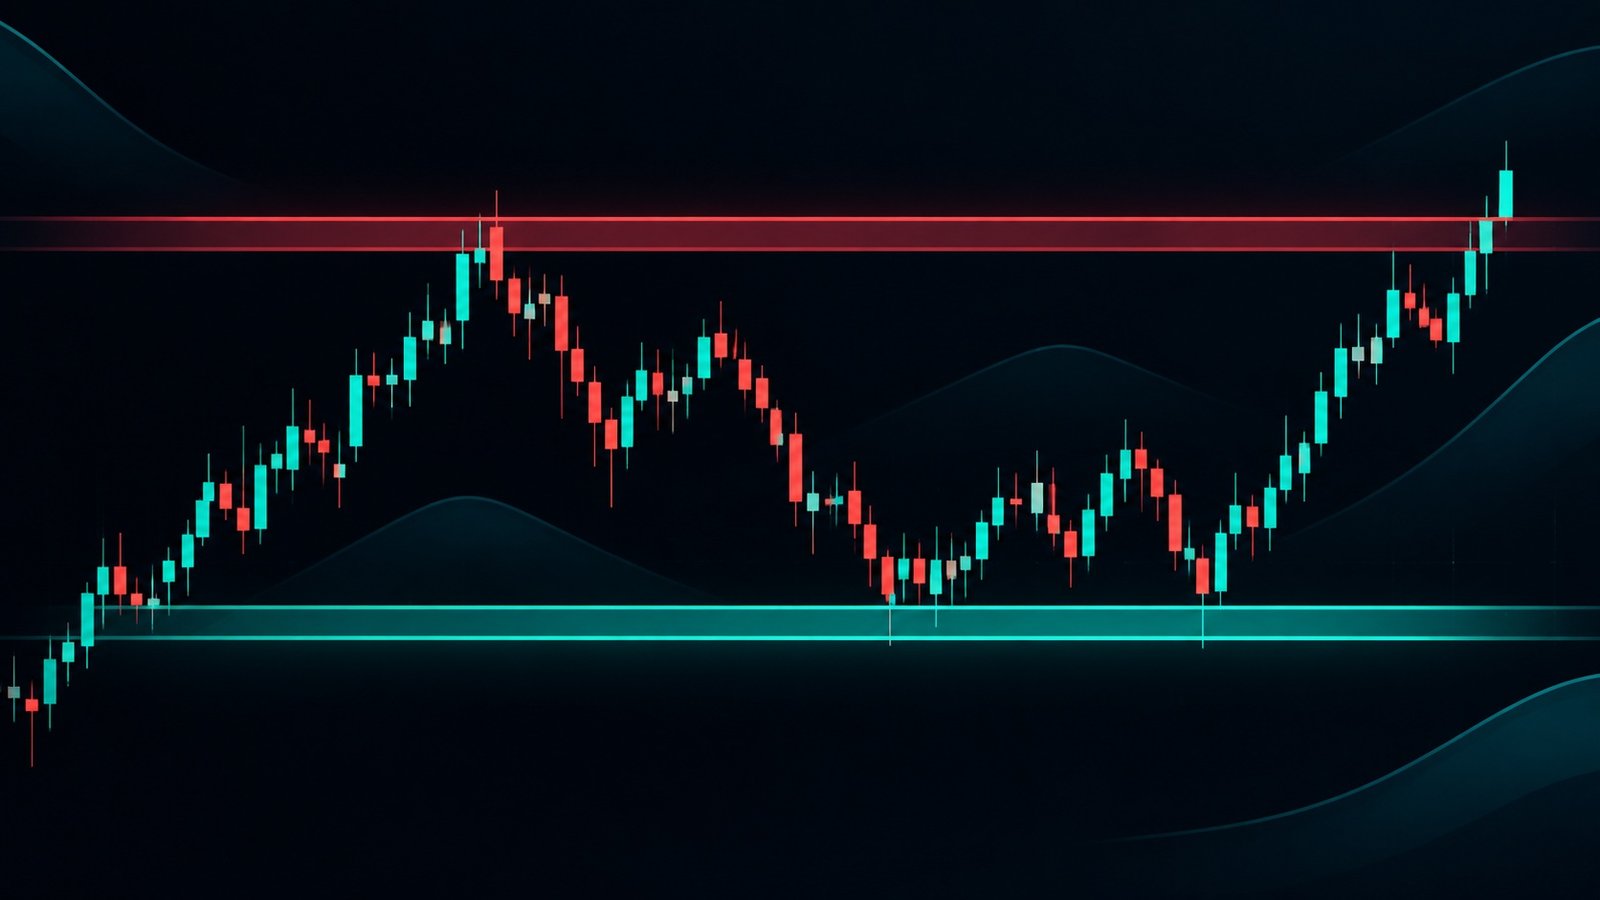
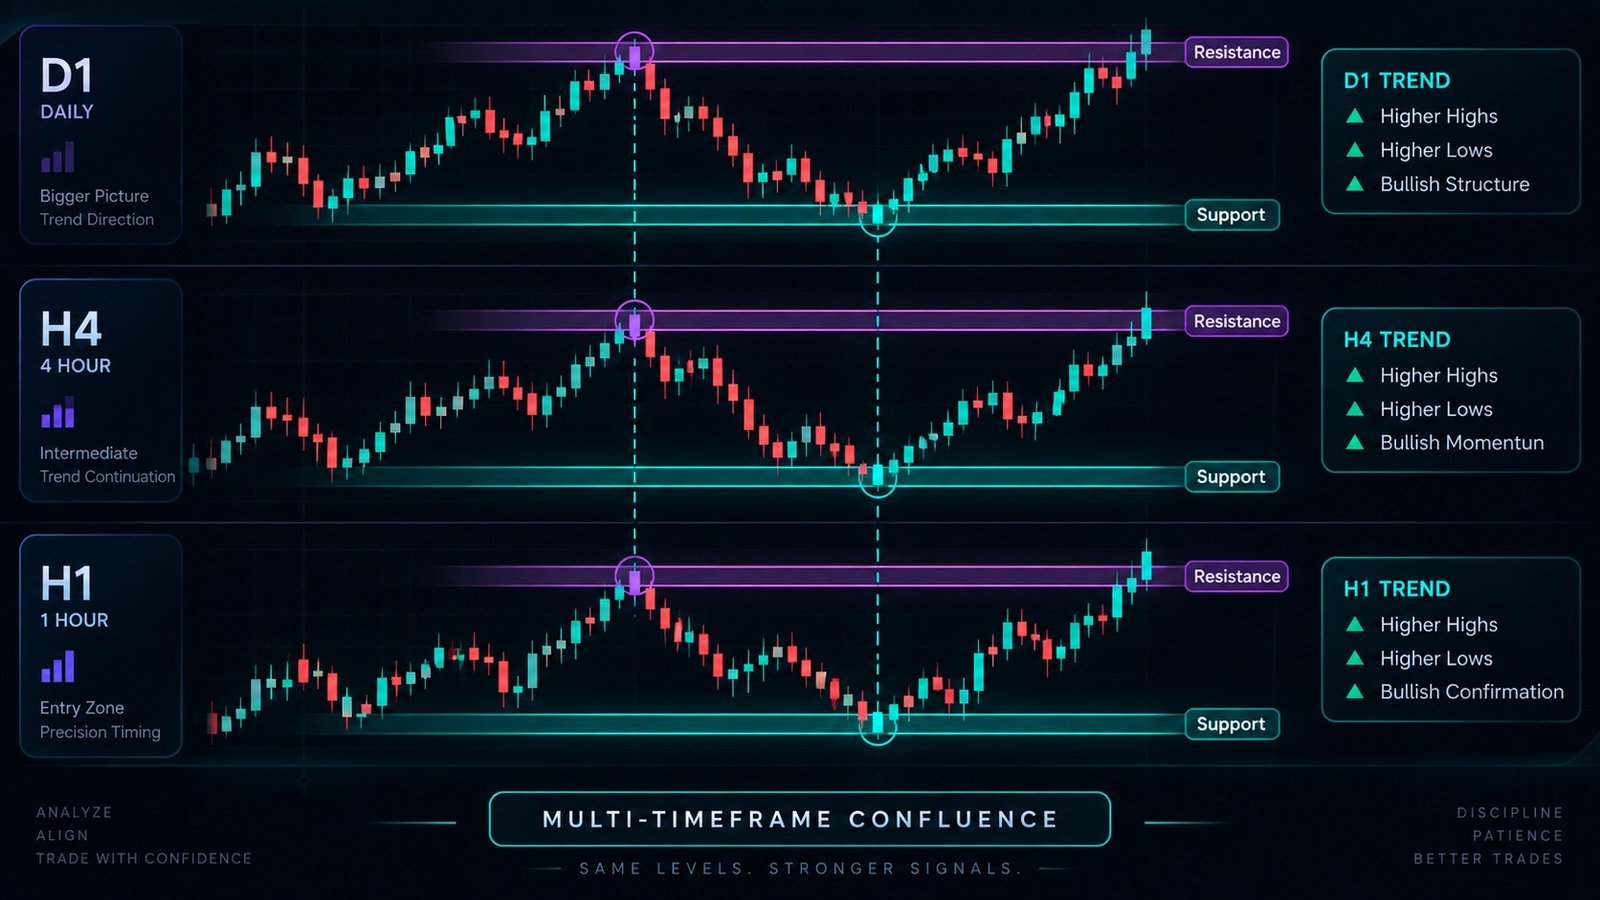
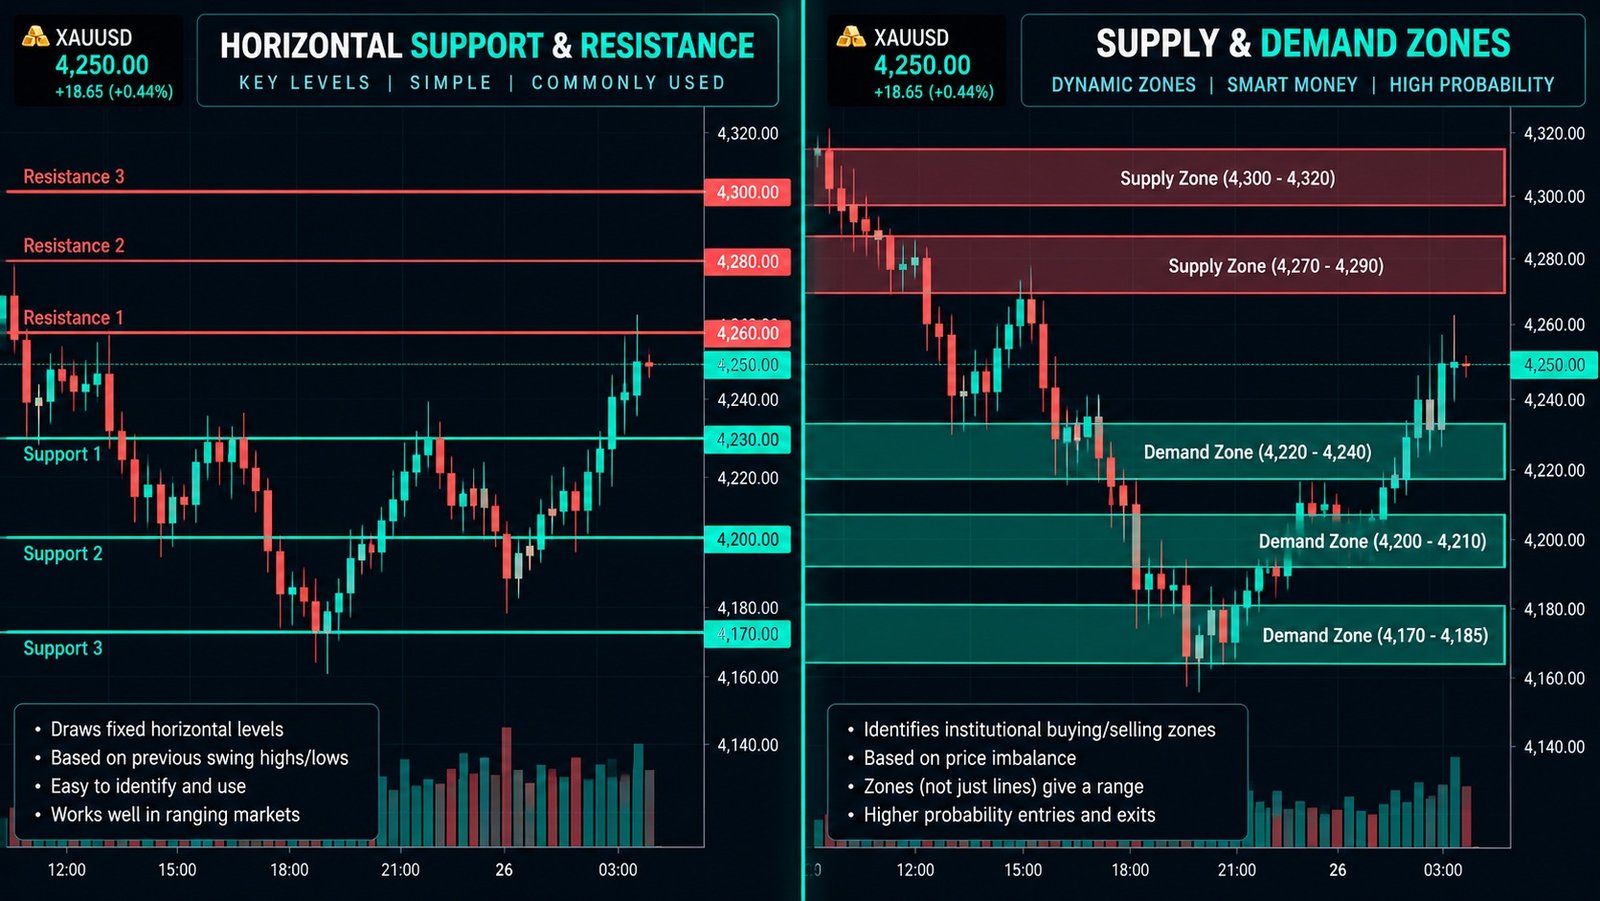
Traditional support and resistance is a horizontal price line drawn where price has previously reversed. Support is below current price (price bounced up from it), resistance is above (price bounced down from it).
The mechanism is behavioral: traders remember previous reversals and place orders at those same prices. When price returns, those orders create a small demand or supply bump — often enough to cause another reversal, at least temporarily.
Support and resistance is:
- Reactive: drawn AFTER price has reversed at a level
- Point-based: a single price value, not a zone
- Symmetrical: old support becomes new resistance after break (and vice versa)
Supply and demand: how it differs
Supply and demand zones are rectangular price areas where a strong directional move originated. The theory: institutional orders that couldn't all be filled at one price left "unfilled orders" in the zone. When price returns, those remaining orders fire — creating a similar directional move.
Supply and demand is:
- Proactive: drawn as soon as the origin move happens, before price returns
- Zone-based: a range of prices, usually the last consolidation before the impulse
- Fresh vs. tested: loses power each time price returns
The overlap
In practice, both concepts identify similar price areas — just with different reasoning and different drawing conventions. A supply zone often sits exactly where classical resistance would be. A demand zone often sits at classical support.
The real difference is how you use them:
- S/R traders wait for price to touch the exact line, then look for a rejection candle to enter.
- S/D traders enter as price enters the zone, using zone edges as stops.
What actually works better
Neither, in isolation. Both have the same weakness: they're drawn by hand, based on subjective judgment, and depend on the trader's eye for what counts as "significant." Two traders looking at the same chart will often draw different levels.
What works is combining both with quantitative rules:
- Identify all previous swing highs/lows (S/R candidates)
- Identify all zones that preceded strong directional moves (S/D candidates)
- Weight them by recency and touch count
- Combine with volatility bands to create actual tradeable ranges
This is what LevelEngine's AI does automatically for 100+ symbols, every day.
The trader who draws levels by hand for one chart is doing work an algorithm can do for 180 charts in one second. The advantage isn't in the drawing — it's in what you decide to do with the levels.
Our buy above / sell below zones
Instead of forcing you to choose between S/R and S/D, our AI computes two zones per symbol per day:
- Buy above: the price level above which the day's bias flips bullish. Below it, expect chop or downside.
- Sell below: the price level below which the day's bias flips bearish.
Both zones are computed using: previous swing structure (S/R input), high-volume origin zones (S/D input), volatility bands (to account for daily range expansion), and macro-event proximity (to widen zones around NFP/CPI/FOMC).
The result is a hybrid: neither purely S/R nor purely S/D. It's built from both, weighted by what has actually worked over the last 60 days for that specific instrument.
When each traditional method wins
When you must trade manually without an engine, use these guidelines:
- Trending markets: S/D zones work better. Trend moves respect origins of previous impulses.
- Ranging markets: S/R lines work better. Ranges bounce off exact prices repeatedly.
- News reactions: Neither works well. Volatility overrides technical structure.
- Low-timeframe scalps: S/R with tight rejection candles.
- Swing trades on H4/D1: S/D zones with wider stops.
The mistake most retail traders make
Drawing 15 different levels on the chart because "you can never have too many." No. Every additional level dilutes the signal. Two clean zones per timeframe is enough. If price hasn't reached one, don't trade.
That's the philosophy behind our daily zones: one buy above, one sell below. Clarity beats coverage every time.
The bottom line
Support/resistance and supply/demand describe the same market phenomenon (institutional order flow leaving footprints) with different vocabularies. Understanding both makes you a better trader. Using an AI that combines both makes you faster.
See how our zones look on XAUUSD, EURUSD, or BTCUSD, or open the terminal to chart your favorite symbol.
Educational content only. Not financial advice.